Htop – Linux Process Monitoring
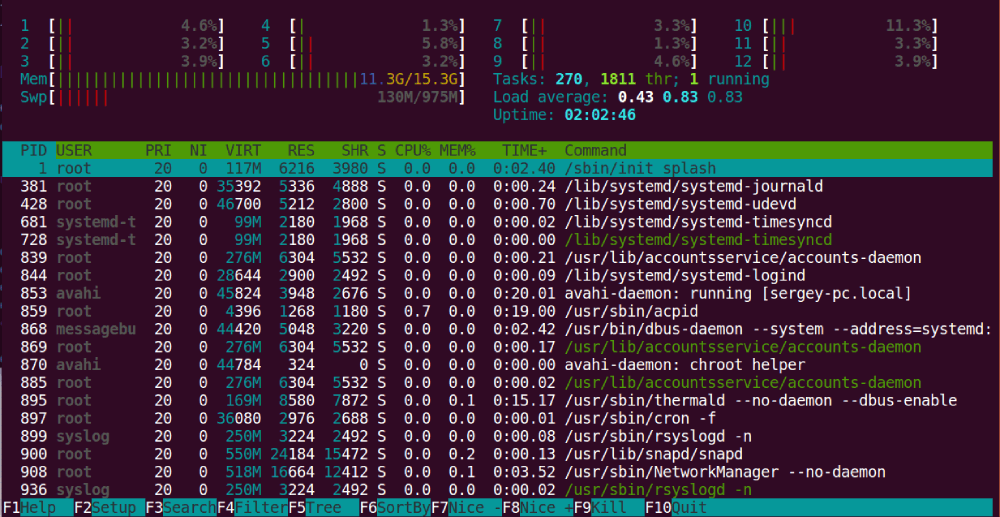
htop is a much advanced interactive and real time Linux process monitoring tool. This is much similar to Linux top command, but it has some rich features like user friendly interface to manage process, shortcut keys, vertical and horizontal view of the processes and much more. htop is a third party tool and doesn't included in Linux systems, you need to install it manually.
Features
- it shows a frequently updated list of the processes running on a computer, normally ordered by the amount of CPU usage;
- it provides a full list of processes running, instead of the top resource-consuming processes;
- it uses color and gives visual information about processor, swap and memory status;
- it can also display the processes as a tree;
- it provides a convenient, visual, cursor-controlled interface for sending signals to processes.
Instalation
Debian / Ubuntu:
$ sudo apt-get install htopCentOs / Fedora:
# yum install htopMacOS:
$ brew install htopUsage
All you have to do is just run it from the terminal:
$ htopNavigating throughout this tools is very easy, especially due to the fact that it supports the work of the cursor.
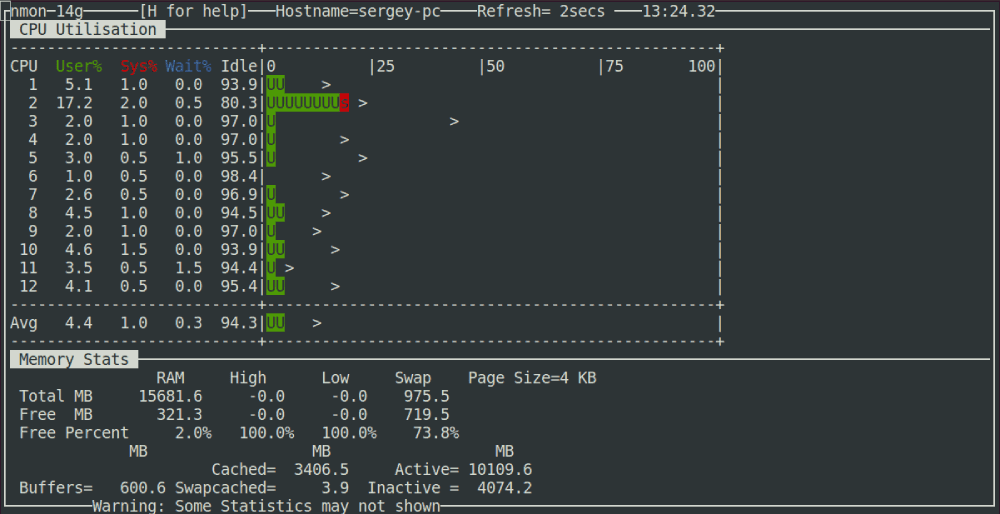
You can also check out other alternatives, like Glances or nmon.
Glances is a good htop alternative as it can adapt dynamically when displaying system information, depending on the terminal size.
nmon is another htop alternative systems administrators tool, for server tuning, benchmarking or viewing detailed system performance information.
IPTraf – Real Time IP LAN Monitoring
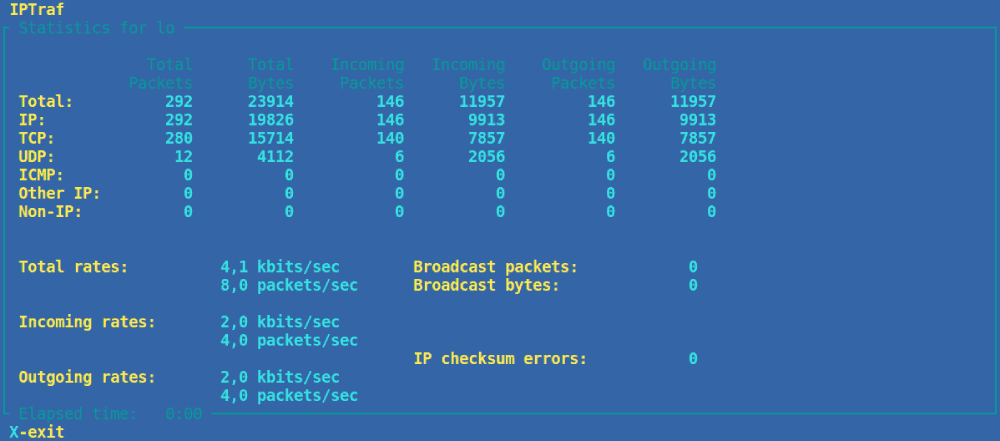
iptraf is an open source console-based real time network (IP LAN) monitoring utility for Linux. It collects a variety of information such as IP traffic monitor that passes over the network, including TCP flag information, ICMP details, TCP/UDP traffic breakdowns, TCP connection packet and byne counts. It also gathers information of general and detaled interface statistics of TCP, UDP, IP, ICMP, non-IP, IP checksum errors, interface activity etc.
Features
- An IP traffic monitor shows information on the IP traffic passing over your network. Includes TCP flag information, packet and byte counts, ICMP details, OSPF packet types.
- General and detailed interface statistics showing IP, TCP, UDP, ICMP, non-IP and other IP packet counts, IP checksum errors, interface activity, packet size counts.
- A TCP and UDP service monitor showing counts of incoming and outgoing packets for common TCP and UDP application ports.
- A LAN statistics module discovers active hosts and shows statistics showing the data activity on them.
- TCP, UDP, and other protocol display filters, allowing you to view only traffic you're interested in.
- Support Logging.
- Supports Ethernet, FDDI, ISDN, SLIP, PPP, and loopback interface types.
- Utilizes the built-in raw socket interface of the Linux kernel, allowing it to be used over a wide range of supported network cards.
- Full-screen, menu-driven operation.
Instalation
Debian / Ubuntu:
$ sudo apt-get install iptrafCentOS / Fedora:
# yum install iptrafUsage
If the iptraf command is issued without any command-line options, the program comes up in interactive mode, with the various facilities accessed through the main menu. Note, that it has to be run with root privileges:
$ sudo iptrafCtop - interface for container metrics
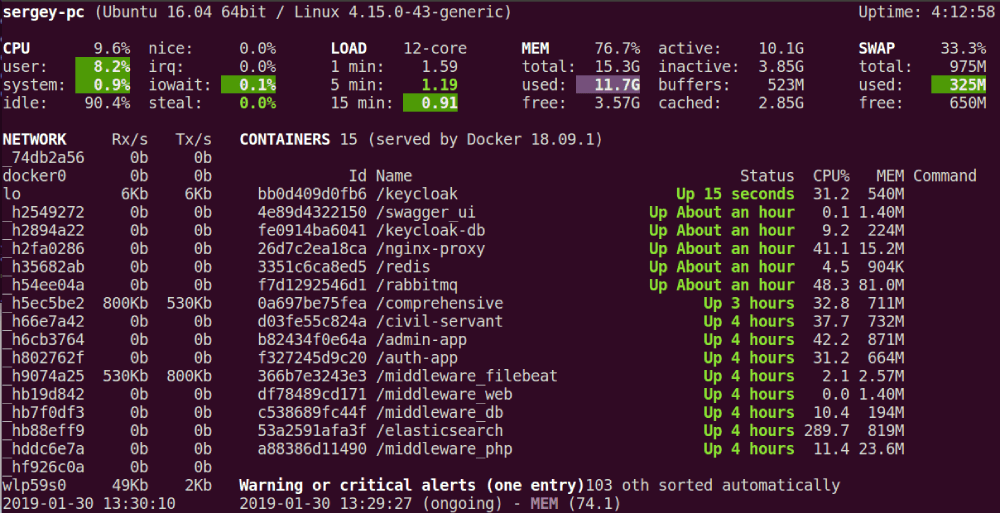
ctop provides a concise and condensed overview of real-time metrics for multiple containers, as well as a single container view for inspecting a specific container.
It mostly works same as
docker stats, but provides a better interface and single container view and logging.
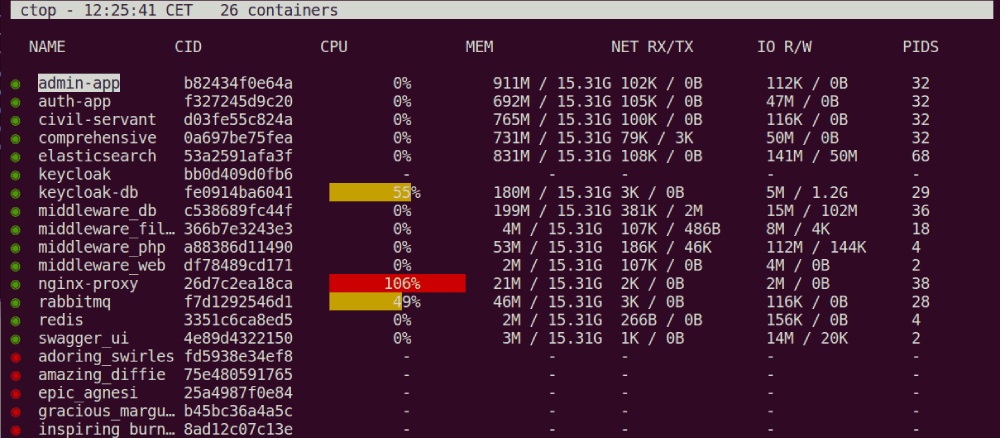
Features
- it shows a frequently updated list of the containers with metrics running on a computer;
- it comes with built-in support for Docker and runC;
- it uses color and gives visual information about CPU, memory and network usage;
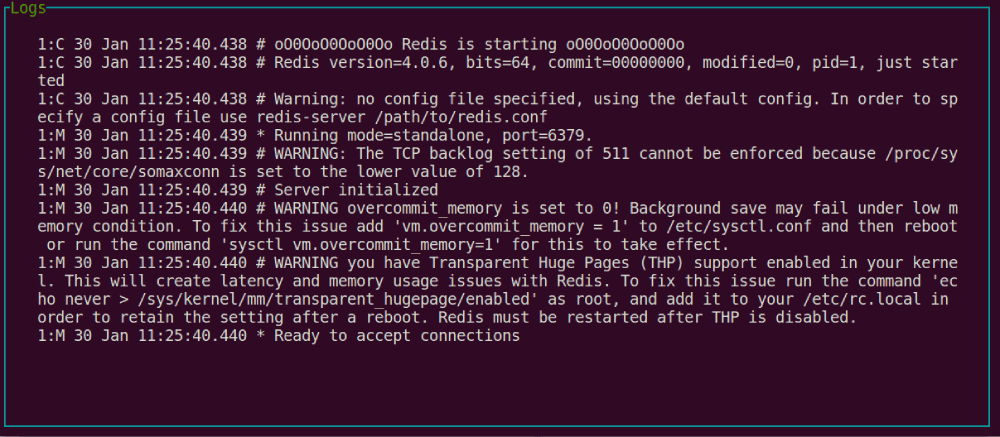
- it shows logs per instance;
- it has a full-screen, menu-driven operation.
Instalation
Linux:
$ sudo wget https://github.com/bcicen/ctop/releases/download/v0.7.2/ctop-0.7.2-linux-amd64 -O /usr/local/bin/ctop
$ sudo chmod +x /usr/local/bin/ctop
MacOS:
$ brew install ctopUsage
ctop requires no arguments and uses Docker host variables by default. To run it, just type it in the terminal:
$ ctopMytop - real-time threads and performance monitoring tools
mytop is an open source, command line tool used for monitoring MySQL performance. Mytop connects to a MySQL server and periodically runs the show processlist and show global status commands. It then summarizes the information in a useful format. Using mytop, we can in real-time monitor MySQL threads, queries, and uptime as well as see which user is running queries on which database, which are the slow queries, and more. All this information can be used to optimize the MySQL server performance.
Features
htop provides a command-line shell interface to monitor real time MySQL/MariaDB threads, queries per second, process list and performance of databases and gives a idea for the database administrator to better optimize the server to handle heavy load.
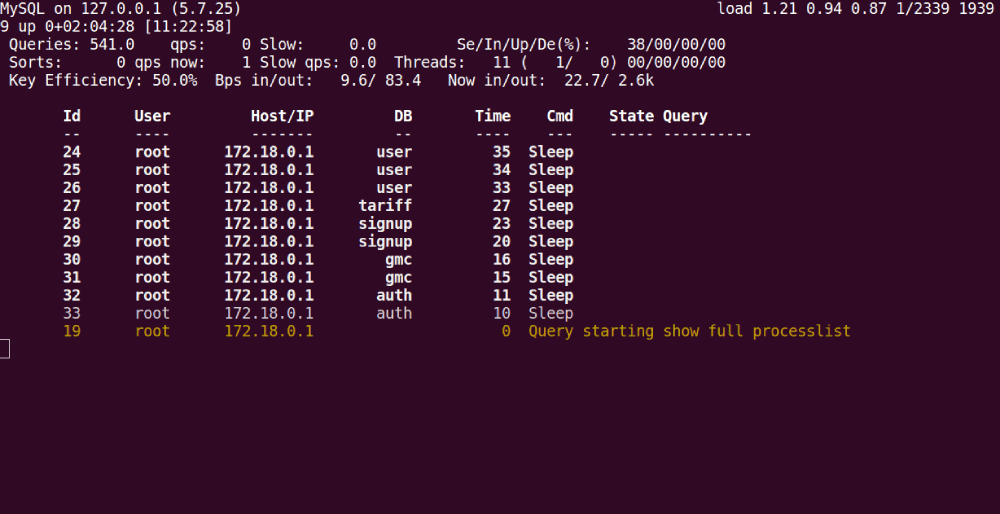
The mytop display screen is really broken into two parts. The top 4 lines (header) contain summary information about your MySQL server:
- The first line identified the hostname of the server and the version of MySQL it is running. The right had side shows the
uptimeof the MySQL server process indays+hours:minutes:secondsformat (much like FreeBSD's top) as well as the current time. - The second line displays the total number of queries the server has processed, the average number of queries per second, the real-time number of queries per second, and the number of slow queries.
- The third line deals with threads. Versions of MySQL before 3.23.x didn't give out this information, so you'll see all zeros.
- And the fourth line displays key buffer efficiency (how often keys are read from the buffer rather than disk) and the number of bytes that MySQL has sent and received.
The second part of the display lists as many threads as can fit on screen. By default they are sorted according to their idle time (least idle first).
Instalation
By default Mytop tool is included in the Fedora and Debian/Ubuntu repositories, so you just have to install it using your default package manager. To install Mytop, run the appropriate command below for your Linux distribution to install it:
$ sudo apt install mytop    # Debian/Ubuntu
# yum install mytop         # RHEL/CentOS
# dnf install mytop         # Fedora 22+
# pacman -S mytop           # Arch Linux
# zypper in mytop           # openSUSE
To prevent inserting connection details, create a customized configuration file for mytop named .mytop in the home directory and add the following content in the file:
user=root
pass=
host=127.0.0.1
db=
port=3306
delay=3
slow=10
socket=
batchmode=0
header=1
color=1
idle=1
long=120
The delay option specifies the amount of time in seconds between display refreshes. The idle parameter specifies whether to allow idle (sleeping) threads to appear in the list in mytop display screen.
Usage
If you configured .mytop file, you can run mytop without any command-line arguments:
$ mytopIf you didn't provide a password in the configuration file, you have to use the --prompt option to mytop, which asks for the password each time:
$ mytop --prompt
Password:
If you need to connect to another database, then in the configuration file, you could run mytop with necessary arguments:
$ mytop -u larapulse -d larapulse_db --promptTL;DR: Conclusion
That's definitely not all useful monitoring tools that exist, so you could find more in resources (links) below. Nevertheless, we think that htop, iptraf, ctop and mytop are the most used in the daily development cycle.