Chart.js library gives us the opportunity to write our own plug-ins, using the Plugin Core API life-cycle methods, but unfortunately, the documentation does not give a detailed description of how and in what order they should be used. Let's go through step-by-step to learn how plugins should be written.
To create a plugin for Chart.js library, first you need to create a JavaScript object with appropriate named functions for any chart state you wish to modify. Chart.js calls all plugins you registered at the following chart order:
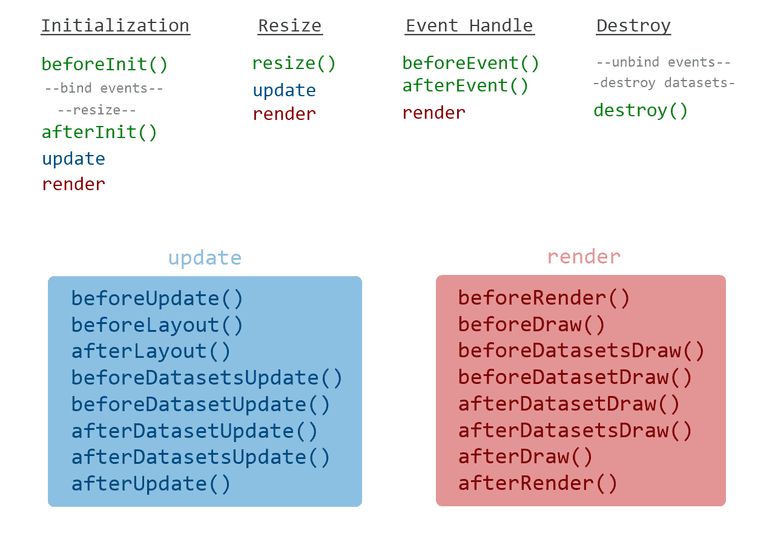
Initialization
beforeInit: Start of initializationafterInit: End of initialization
Update
beforeUpdate: Start of updatebeforeLayout: Before layout update. Iffalsereturned, layout will not be updatedafterLayout: After layout updatebeforeDatasetsUpdate: Start of datasets update. Iffalsereturned, datasets will not be updatedbeforeDatasetUpdate: Start of dataset update. Iffalsereturned, dataset will not be updatedafterDatasetsUpdate: End of datasets updateafterUpdate: End of update
Render:
beforeRender: This is called at the start of a render, before render occurs. It is only called once (exceptresizeor otherevents), even if the animation will run for a number of frames. UsebeforeDrawto do something on each animation frame. Iffalsereturned, chart will not be renderedbeforeDraw: Start of draw. Iffalsereturned, chart will not be drawnbeforeDatasetsDraw: Before datasets draw. Iffalsereturned, datasets will not be drawnbeforeDatasetDraw: Start of dataset drawing. Iffalsereturned, dataset will not be drawnafterDatasetDraw: End of dataset drawingafterDatasetsDraw: After datasets drawafterDraw: End of drawafterRender: After render occurs
beforeEvent: Before event handleafterEvent: After event handleresize: Resizedestroy: Destroy canvas
After you configure your plugin object, pass it to Chart.pluginService.register(<Plugin_Object>); to let Chart.js know to register the plugin.
Example object with all lifecycle functions and their attributes to create plugin would be looks like:
import Chart from "chart.js";

// Create the plugin object with lifecycle methods
const customPlugin = {
  beforeInit: chartInstance => {},
  afterInit: chartInstance => {},

  beforeUpdate: chartInstance => {},
  beforeLayout: chartInstance => {},
  afterLayout: chartInstance => {},
  beforeDatasetsUpdate: chartInstance => {},
  beforeDatasetUpdate: (chartInstance, { index, meta }) => {},
  afterDatasetUpdate: (chartInstance, { index, meta }) => {},
  afterDatasetsUpdate: chartInstance => {},
  afterUpdate: chartInstance => {},

  beforeRender: chartInstance => {},
  afterRender: chartInstance => {},

  beforeDraw: (chartInstance, easingValue) => {},
  afterDraw: (chartInstance, easingValue) => {},

  beforeDatasetsDraw: (chartInstance, easingValue) => {},
  beforeDatasetDraw: (chartInstance, { index, meta, easingValue }) => {},
  afterDatasetDraw: (chartInstance, { index, meta, easingValue }) => {},
  afterDatasetsDraw: (chartInstance, easingValue) => {},

  beforeEvent: (chartInstance, { chart, native, type, x, y }) => {},
  afterEvent: (chartInstance, { chart, native, type, x, y }) => {},

  resize: (chartInstance, newChartSize) => {},

  destroy: chartInstance => {}
};

// Register plugin to enable it in Chart.js
Chart.pluginService.register(customPlugin);
Current plugin will not affect chart as functions has empty body. To make this plugin useful one would need to add code to the functions that modifies the chart.
Example plugin to change background color on chart could be written as follows:
const changeBackgroundPlugin = {
    beforeDraw: chart => {
        const { chartStyles = {} } = chart.config.options;
        if (chartStyles && chartStyles.backgroundColor) {
            const { ctx } = chart.chart;
            const { chartArea : area } = chart;

            ctx.save();
            ctx.fillStyle = chartStyles.backgroundColor;
            ctx.fillRect(area.left, area.top, area.right - area.left, area.bottom - area.top);
            ctx.restore();
        }
    }
};ResourcesClick to expand/shrink